R has no error bar function? Surely not!
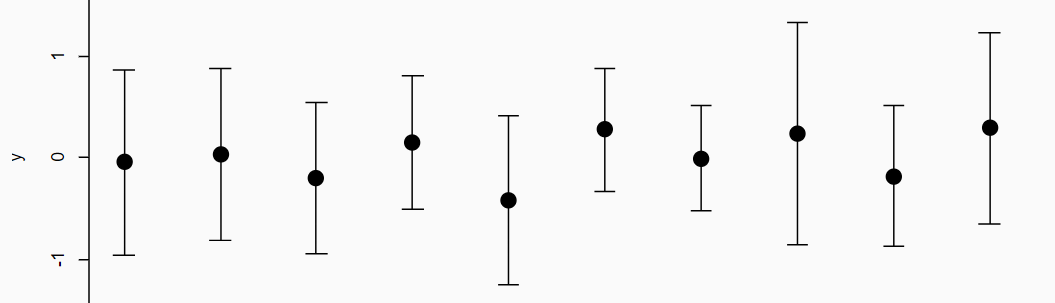
Well, yes and no. Error bars can be added to plots using the arrows() function and changing the arrow head. You can add vertical and horizontal error bars to any plot type. Simply provide the x and y coordinates, and whatever you are using for your error (e.g. standard deviation, standard error).
Read on to see how this is done with examples.