Pages (Desktop)

Pages (Mobile)

Bathymetric maps in R: Getting and plotting data

Bathymetric maps are topographic maps of water bodies (oceans, seas, lakes, rivers), equivalent to Digital Elevation Models (DEMs), except for submerged terrain.

Useful in their own right, bathymetric maps can also improve the look of maps created using DEMs, giving depth to water features.

This 2-part guide shows you how to create bathymetric maps in R using freely available data from online sources, how to import and plot this in R. Part 2 explores using different colour schemes/palettes for really effective maps. Read on for more!



Bathymetric maps in R: Colour palettes and break points

Part 2 of the guide for making bathymetric maps in R. This part focuses on creating effective colour schemes using break points to control the colour.


DEMs and where to find them

Digital Elevation Models (DEMs) are a 3D representation of the terrain, and can form the basis for creating maps, or carrying out spatial analysis.

DEMs come in many shapes and sizes, from commercial DEMs with 1 m spatial resolutions, to freely available DEMs with 30 m to 90 m resolutions.

In this guide, I'll show you some of the freely available DEMs, where to obtain the data, and how to use them in R. Read to find out how!


Creating simple location maps in R

R has some great GIS capabilities thanks to an extensive range of packages for handling GIS data. I have previously shown some of this capability for creating climate data maps, although I have not explored mapping basics, until now.

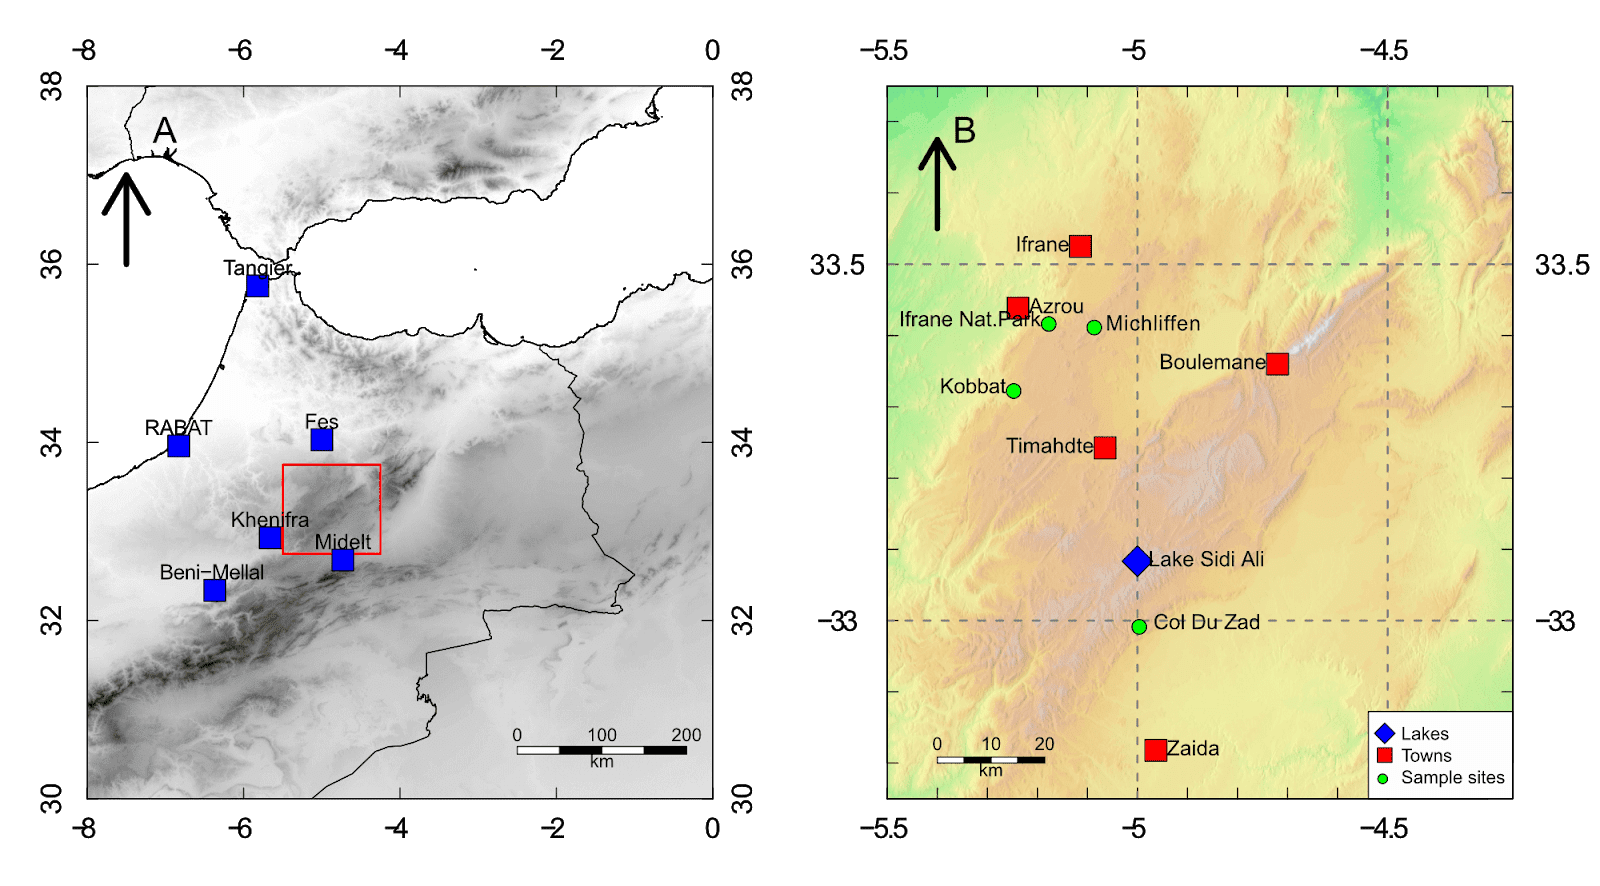
This guide will show you some basic techniques for creating simple, yet effective location maps in R, using freely available data. Stop using screenshots of Google Earth for your location maps, and start making your own! No GIS skills are needed. Read on to see how the create the map below!


How to add error bars in R

R has no error bar function? Surely not!

Well, yes and no. Error bars can be added to plots using the arrows() function and changing the arrow head. You can add vertical and horizontal error bars to any plot type. Simply provide the x and y coordinates, and whatever you are using for your error (e.g. standard deviation, standard error).

Read on to see how this is done with examples.


Quick guide to opening files from within R

R has loads of useful, but little known functions that can make life a little bit easier. As part of the "quick guide" series, this quick guide takes a look at opening files from within R - no more opening up file explorer and hunting around for that file!