Pages (Desktop)

Pages (Mobile)

Showing posts with label datasets. Show all posts

Interpolating gridded datasets in R: UV-B data

In my most recent published paper, I analysed the effects of incoming solar UV-B radiation on the geochemistry of Atlas cedar pollen, focused on the Middle Atlas Mountains in Morocco. The study area was relatively small, with sample sites fairly close together.

The UV-B data was obtained from the glUV: Global UV-B radiation dataset, which combines data from NASA's Ozone Monitoring Instrument (OMI) onboard the Aura spacecraft, into grid cells containing average erythemally weighted estimates of daily UV-B radiation. You can read full details of the methods used in the associated research paper (Beckmann et al. 2014) (Available open access).

Gridded datasets are an excellent source of data for doing global or macro-scale studies. However, if working in a relatively small area, you may find that your study area is covered by just a few grid cells due to the often low resolution of gridded data. And this can sometimes make it more difficult to carry out analysis.

To overcome the problem, you can interpolate the data to increase the resolution. After interpolation, the gridded data will go from looking like the image on the left, to looking like the image on the right, which is much more detailed for the study area.
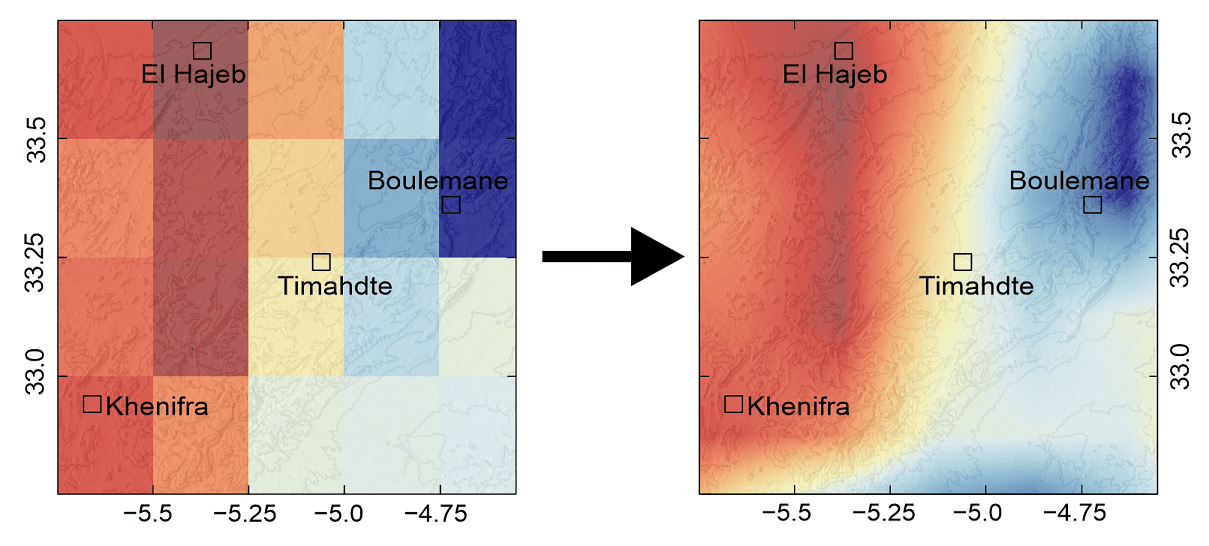
Read on to find out how to do this in R!


Sources of climate data

In my recent guide series looking at extracting, analysing and plotting climate data using R, I focused on two sources of climate data: CRU and WorldClim. These datasets provide all kinds of climate data, at varying temporal and spatial resolutions. But, as mentioned in the last post, there are many more climate datasets available, with data for even more climate variables.

Unless you know exactly what you're looking for, finding the data you're after can be a bit of a struggle. This is where the Climate Data Guide from NCAR comes in! Described as: Data discovery guided by experts, this website lists almost 200 different climate datasets, providing information about the dataset, metadata, the strengths and weaknesses of the data, example figures, and links to download the data. An overview of the Climate Data Guide can be read on the about page or in this research paper

Here's an example from their guide for the CRU gridded datasets (Available from https://climatedataguide.ucar.edu/climate-data/cru-ts-gridded-precipitation-and-other-meteorological-variables-1901)

Visit the Climate Data Guide for a look at more datasets.

Global climate datasets are not the only source of climate data. Raw station data is often available. Click read more to find out about climate station data available from NOAA, the Met Office, and the Environment Agency.


Getting Climate Data

Have you ever needed weather information or climate data for a project you are working on, such as a dissertation or thesis? Depending on which part of the world you need data for, sometimes it can prove very difficult to obtain good reliable climate datasets. While some agencies make weather station data freely accessible e.g. NOAA, others may restrict access. You might also want to look at climate data on large or global scales, where obtaining data from individual agencies can become more complex.

Luckily, there are several global climate datasets available, which have done all the hard work of collating and processing the climate data into an easily accessible and consistent format.

In part one of this guide, I will show you how to obtain climate data from the Climate Research Unit (CRU) and extract only the data you need for your project using R. In part two of this guide (coming soon!), I will show you how you can manipulate this data, while part three will show you how to extract climate data from WorldClim datasets.