In the final part of this expanded guide series introducing you to R, this guide gives you an overview of the graphics systems in R, and gets you started creating plots using base graphics.
In the final part of this expanded guide series introducing you to R, this guide gives you an overview of the graphics systems in R, and gets you started creating plots using base graphics.
Hello! you may have noticed a lack of updates to the blog in the last two years. This was in part due to me buying a house and spending a long time renovating it (and the garden), which took up most of my spare time. Since that is now *mostly* complete (it is never complete), I am able to spend some time updating the blog again.
Since i first started the blog, I have become more experienced in using R and use it in many more different ways compared to how I first started. I also now try and write more efficient R code, usually in the form of functions, than what i did previously. Looking back at some of my guides, much of the code is "inefficient", but it is accessible to beginners. As part of updates, I intend to revisit several of my guides and update them with new code and new explanations. However, the goal of the blog is to always make the code accessible to everyone, and that will not change.
I've also made a few changes to the site to tweak the design slightly. These changes are quite minor so you may not notice them, but they should "tidy up" some of the design. If you notice any errors, please let me know!
Additionally, the guides on the blog now have a new "information" panel. Here's an example:
| Title | My uber guide |
| Author | Benjamin Bell |
| Published | Today |
| Last updated | |
| R version | 4.1.1 |
| Packages | base |
| Navigation |
|
This will replace the information boxes that previously showed on each guide, and keep all the useful details in one place.
There are definitely some new guides coming soon (really this time), and to start, why don't you check out the completely rewritten and updated guide to using different line types in R?
Bathymetric maps are topographic maps of water bodies (oceans, seas, lakes, rivers), equivalent to Digital Elevation Models (DEMs), except for submerged terrain.
Useful in their own right, bathymetric maps can also improve the look of maps created using DEMs, giving depth to water features.
This 2-part guide shows you how to create bathymetric maps in R using freely available data from online sources, how to import and plot this in R. Part 2 explores using different colour schemes/palettes for really effective maps. Read on for more!

Part 2 of the guide for making bathymetric maps in R. This part focuses on creating effective colour schemes using break points to control the colour.

Digital Elevation Models (DEMs) are a 3D representation of the terrain, and can form the basis for creating maps, or carrying out spatial analysis.
DEMs come in many shapes and sizes, from commercial DEMs with 1 m spatial resolutions, to freely available DEMs with 30 m to 90 m resolutions.
In this guide, I'll show you some of the freely available DEMs, where to obtain the data, and how to use them in R. Read to find out how!
R has some great GIS capabilities thanks to an extensive range of packages for handling GIS data. I have previously shown some of this capability for creating climate data maps, although I have not explored mapping basics, until now.
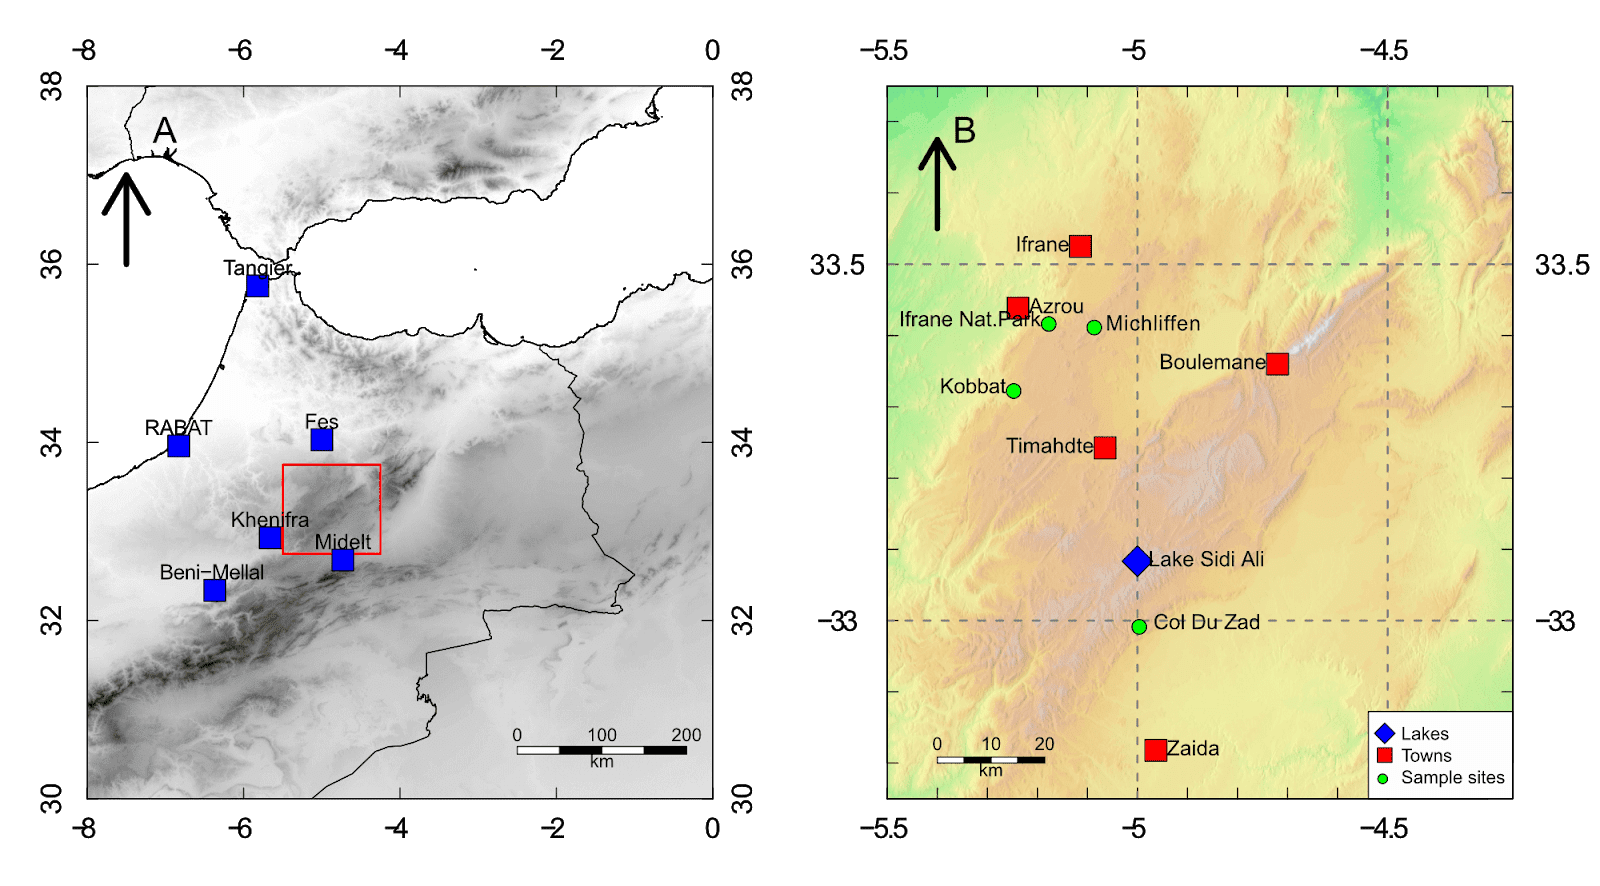
This guide will show you some basic techniques for creating simple, yet effective location maps in R, using freely available data. Stop using screenshots of Google Earth for your location maps, and start making your own! No GIS skills are needed. Read on to see how the create the map below!
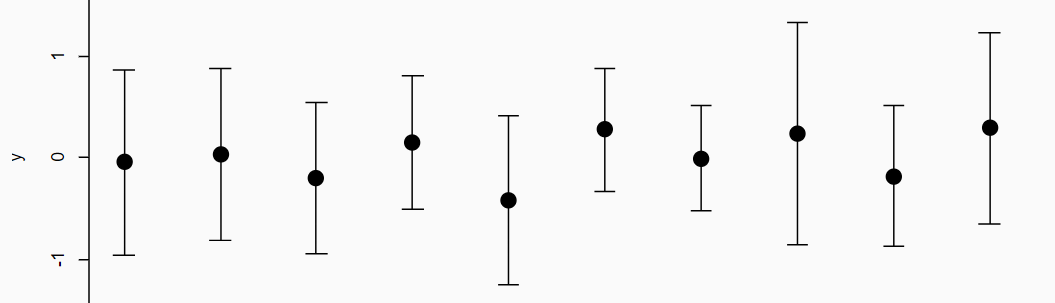
R has no error bar function? Surely not!
Well, yes and no. Error bars can be added to plots using the arrows() function and changing the arrow head. You can add vertical and horizontal error bars to any plot type. Simply provide the x and y coordinates, and whatever you are using for your error (e.g. standard deviation, standard error).
Read on to see how this is done with examples.
R has loads of useful, but little known functions that can make life a little bit easier. As part of the "quick guide" series, this quick guide takes a look at opening files from within R - no more opening up file explorer and hunting around for that file!
Apologies for lack of blog updates recently, I am pleased to say I recently started a new job researching glaciers and environmental change in the High Atlas, Morocco, which is keeping me busy! We have just launched a new website for the project, so please check it out to find out more! https://www.highatlasresearch.com/
As well as my new job role, I have also been working on a brand new project which I hope to reveal in the new year! Updates to this blog are coming in the new year, and will include a new R guide series for creating maps, and also a new guide series to using LaTeX for writing thesis and dissertations.

If you're attending this years EPPC 2018 - please come along and check out my poster presentation on pollen geochemistry of Atlas cedar, and how it can be used to tell us about the climate and environment.
If you can't make the conference, or would like to know more details about this work, read on!
First, a little background information. Atlas cedar (Cedrus atlantica) is an endemic conifer tree found growing across Morocco in the Rif Mountains, Middle Atlas, and parts of the High Atlas. It is also found in Algeria in the Tell Atlas, and Aures Mountains. Cedar has been in the region for thousands of years, but it is threated by climate change, extreme drought and human activity - particularly logging and grazing.
Because of the tree's longevity, and because it is the only species of Cedrus growing in the region, it is an ideal species to study to learn about the environment and climate of the past. We can be sure that analysis of fossil cedar pollen (from lake sediment and peat sediment cores) in the region comes from Atlas cedar. Unlike for example, pine, where the pollen may be from several different pine species (although analysis of pine geochemistry can identify pollen to the species' level).
Cedar is also an early autumn (fall) pollinating species, which means the pollen develops during the summer months, and its geochemistry is influenced by summer conditions.
In a previous blog post, I discussed pollen geochemistry in relation to how it is used to tell us about solar UV-B levels. Check out the post to learn more.
This blog post will cover stable isotope analysis of Atlas cedar pollen, ongoing work looking at fossil cedar pollen, and describe a method for isolating cedar pollen without using traditional chemical treatments.