Have you ever needed weather information or climate data for a project you are working on, such as a dissertation or thesis? Depending on which part of the world you need data for, sometimes it can prove very difficult to obtain good reliable climate datasets. While some agencies make weather station data freely accessible e.g. NOAA, others may restrict access. You might also want to look at climate data on large or global scales, where obtaining data from individual agencies can become more complex.
Luckily, there are several global climate datasets available, which have done all the hard work of collating and processing the climate data into an easily accessible and consistent format.
In part one of this guide, I will show you how to obtain climate data from the Climate Research Unit (CRU) and extract only the data you need for your project using R. In part two of this guide (coming soon!), I will show you how you can manipulate this data, while part three will show you how to extract climate data from WorldClim datasets.
Guide Information
| Title | Getting Climate Data |
| Author | Benjamin Bell |
| Published | January 11, 2018 |
| Last updated | August 17, 2021 |
| R version | 3.4.2 |
| Packages | base; raster; ncdf4 |
| Navigation |
This guide has been updated:
- Since this guide was originally published, CRU have released new versions of the CRU TS dataset. You can still download the older versions of the dataset (and the screenshots have been updated to reflect this), or you can download the latest version, and follow this guide using the latest data, as the code should still work.
This is a 4 part guide:
| Part 1: Getting Climate Data | Downloading CRU climate data and opening it in R. |
| Part 2: Working with extracted CRU climate data | How to use the downloaded climate data, from calculating trends to plotting the data. |
| Part 3: Extracting data and making climate maps using WorldClim datasets | How to obtain WorldClim climate data, importing it into R, and how to calculate trends and plot climate maps. |
| Part 4: RasterStacks and raster::plot | An update to part 3, this guide shows you an easier way to import WorldClim data into R by using RasterStacks. |
Getting CRU climate data
This is part one of a guide that will take you through the complete process of downloading climate data, opening it in R, and then extracting only the data you want for your sites, step by step. In the next guide i will show you can work with and manipulate this data, while future guides will look at plotting the climate data.
The Climatic Research Unit (CRU) at the University of East Anglia provides gridded climate datasets on past and present climate. For this guide, we will be using the High-resolution gridded dataset: CRU TS, which provides time-series global land climate data on a 0.5° x 0.5° degree grid, which is an area approximately 55 km2.
CRU TS provides data for: cloud cover, diurnal temperature range, potential evapotranspiration (PET), daily mean temperatures, mean maximum temperature, mean minimum temperature, precipitation, and vapour pressure. Full details about the dataset is available in the associated research paper (Harris et al. 2013).
The latest version of the dataset: v4.01, provides this data as monthly data for the period 1901 - 2016. The 4.xx series uses an updated method for calculating the gridded climate data, which differs from the previous 3.xx releases. You can still download v3.25.01 of the dataset, which covers the same period, but this series of datasets will no longer be maintained. Details about the changes and how they are created can be found in the release notes.
Downloading the data
Update: CRU TS v4.01 has now been superseded - but you can still download that version to use with this guide, or the newer versions should also work.
For this guide, we will be using CRU TS v4.01 and looking at precipitation and mean temperature, we will make use of several R packages, but firstly, we need to download the data.
The data can be downloaded from the Centre for Environmental Data Analysis, using this permalink: http://doi.org/10/gcmcz3 which will present you with a page that looks like this: (Correct at 17/08/2021)
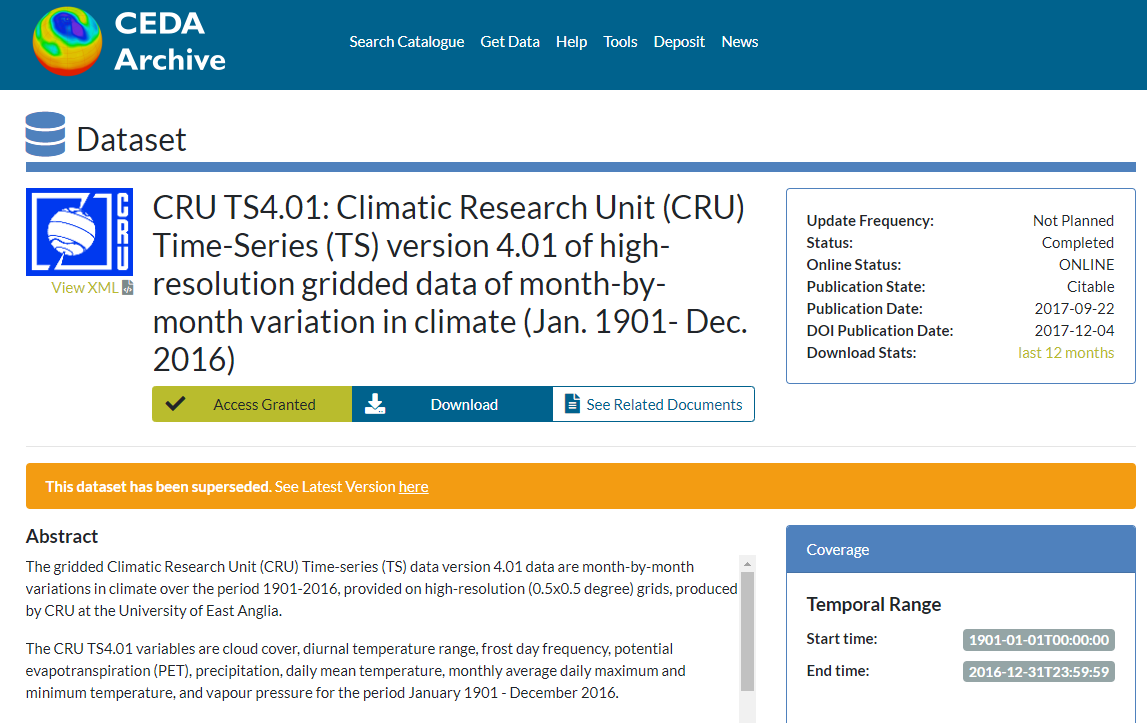
You first need to register to access the data, so click on the "Register/Login for Access" button and follow the instructions. Once you are registered and have logged in, click the "Download" button to download the available data, which will present you with this page:
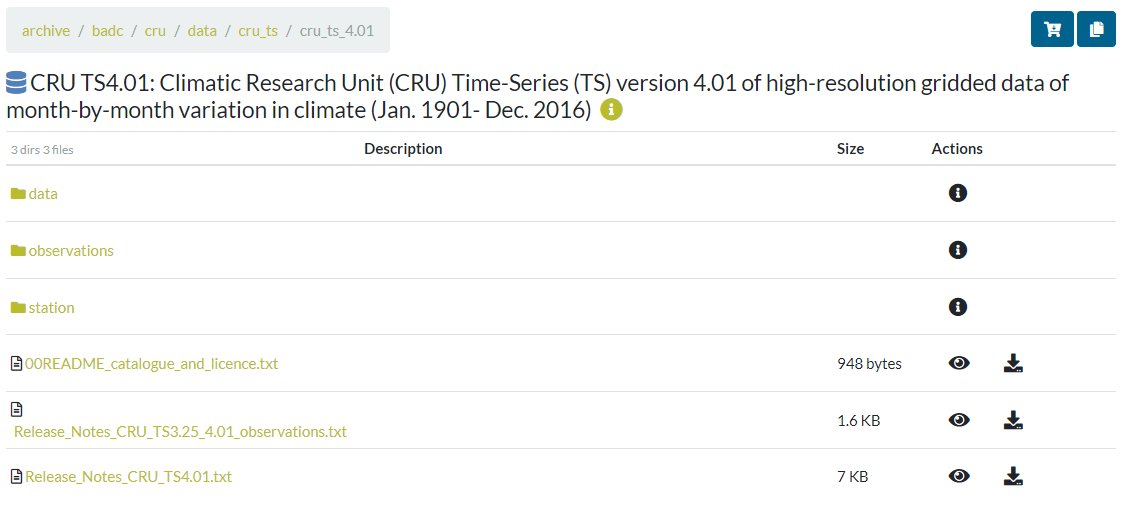
Firstly, we are going to get precipitation data, so you should click on the "data" folder, then the "pre" folder. We want precipitation data for the full period of 1901 to 2016, so you need to find the file "cru_ts4.01.1901.2016.pre.dat.nc.gz" and then click the download link to save the file to your computer.
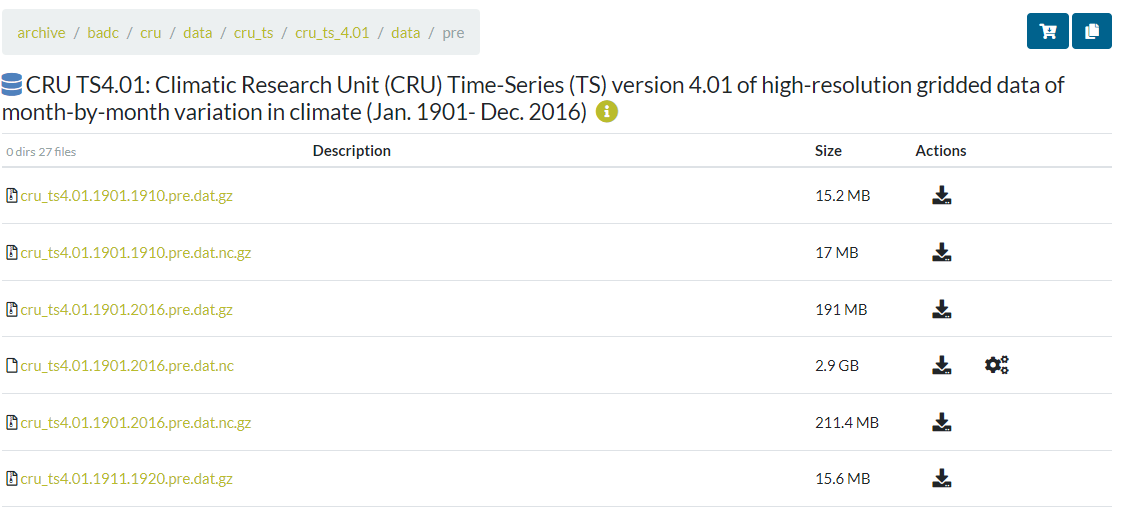
We also want mean temperature data, so, starting from the data folder, click the "tmp" folder to find the file "cru_ts4.01.1901.2016.tmp.dat.nc.gz" and download this to your computer. These files are compressed ".gz" files which you need to first extract, in order to open them in R. A list of programs that can extract .gz files can be found here for Windows, Mac OS X and Linux. On Windows, I would recommend 7-Zip (free and open source) which can open just about any archive file.
For each R project you are going to work on, it is generally a good idea to create a separate folder to work in. So, I would suggest you save the climate data to a new folder, e.g. "CRU climate" within your R working directory.
Extracting the climate data using R
To work with the CRU datasets in R, you first need to install some additional packages: "ncdf4" in order to read the data files, and "raster" which can extract and plot the data.
To install a package in R, use the command install.packages() and put the package name (case sensitive) within the parenthesis and enclosed with quotation marks. For example, to install the "raster" package, type the following command into the R console:
> install.packages("raster")
On the first time you try and install a package after opening R, it will ask you to select a download mirror - select whichever is closest to your location, and the package will then download and install automatically. Then repeat the process to install ncdf4.
After you have installed the packages, you will need to load them for this R session. If you were to close the R environment and reopen it, you would need to reload the packages.
Use the following code to load the packages in R:
# Extracting CRU Climate data: CRU TS v4.01
# Complete guide available at: http://www.benjaminbell.co.uk

# Load packages
library(raster)
library(ncdf4)
Before you extract any climate data, it is a good idea to first take a look at the information provided by the data file, which is in NetCDF format. This format is often used for large datasets, and can be easily read using R.
In the R console, first change the working directory using the setwd() command to the same folder in which you have downloaded the climate data (or your R project folder).
For example, if you are using Windows and you have an R working directory on your C:\ drive, and created the subfolder "CRU climate", you would set the working directory using the following command:
> setwd("C:/R/CRU climate")
Note, that when using R on Windows systems, you need to use a forward slash (/) instead of a backslash (\) when using file locations. Forward slash for file locations is standard on Mac OS X and Linux.
You can confirm which directory you are currently working in by using the getwd() command. e.g.
> getwd()
 [1] "C:/R/CRU climate"
To view information about the CRU precipitation data file, use the nc_open() command from the "ncdf4" package, followed by the print() command, which will output the following information:
> nc.pre <- nc_open("cru_ts4.01.1901.2016.pre.dat.nc")
> print(nc.pre)
File C:/R/CRU climate/cru_ts4.01.1901.2016.pre.dat.nc (NC_FORMAT_CLASSIC):

     2 variables (excluding dimension variables):
        float pre[lon,lat,time]
            long_name: precipitation
            units: mm/month
            correlation_decay_distance: 450
            _FillValue: 9.96920996838687e+36
            missing_value: 9.96920996838687e+36
        int stn[lon,lat,time]
            description: number of stations contributing to each datum

     3 dimensions:
        lon  Size:720
            long_name: longitude
            units: degrees_east
        lat  Size:360
            long_name: latitude
            units: degrees_north
        time  Size:1392   *** is unlimited ***
            long_name: time
            units: days since 1900-1-1
            calendar: gregorian

    8 global attributes:
        Conventions: CF-1.4
        title: CRU TS4.01 Precipitation
        institution: Data held at British Atmospheric Data Centre, RAL, UK.
        source: Run ID = 1709081022. Data generated from:pre.1704241136.dtb
        history: Fri  8 Sep 2017 12:54:11 BST : User ianharris : Program makegridsauto.for called by update.for
        references: Information on the data is available at http://badc.nerc.ac.uk/data/cru/
        comment: Access to these data is available to any registered CEDA user.
        contact: BADC
This tells us that the precipitation data file has two variables "pre" and "stn", and it provides a description of what they tell us: "pre" being total precipitation (mm/month), and "stn" being the number of climate stations that were used for the grid square. For now, we are only concerned with the "pre" variable.
The dimensions refer to longitude and latitude, so from the file information we can see that the file contains climate data for 720 x 360 grid squares covering the entire globe. It also tells us the format of the coordinates system. The third dimension represents time, covering each month between January 1901 and December 2016. This represents 1392 data entries, which can be confirmed by multiplying the number of years (116) by the number of months (12), which equals 1392.
Now that we have had a look at the file information, we now know the name of the variable we want to extract, so we can go ahead and use R to load the data.
# Load the CRU TS precipitation dataset into R
pre <- brick("C:/R/CRU climate/cru_ts4.01.1901.2016.pre.dat.nc", varname="pre")
The above code loads the NetCDF file as a "RasterBrick" object (similar to an array) into memory using the raster package. - you can view information about the RasterBrick by simply inputting the object name into R. For example:
> pre
class       : RasterBrick
dimensions  : 360, 720, 259200, 1392  (nrow, ncol, ncell, nlayers)
resolution  : 0.5, 0.5  (x, y)
extent      : -180, 180, -90, 90  (xmin, xmax, ymin, ymax)
coord. ref. : +proj=longlat +datum=WGS84 +ellps=WGS84 +towgs84=0,0,0
data source : C:\R\CRU climate\cru_ts4.01.1901.2016.pre.dat.nc
names       : X1901.01.16, X1901.02.15, X1901.03.16, X1901.04.16, X1901.05.16, X1901.06.16, X1901.07.16, X1901.08.16, X1901.09.16, X1901.10.16, X1901.11.16, X1901.12.16, X1902.01.16, X1902.02.15, X1902.03.16, ...
Date        : 1901-01-16, 2016-12-16 (min, max)
varname     : pre
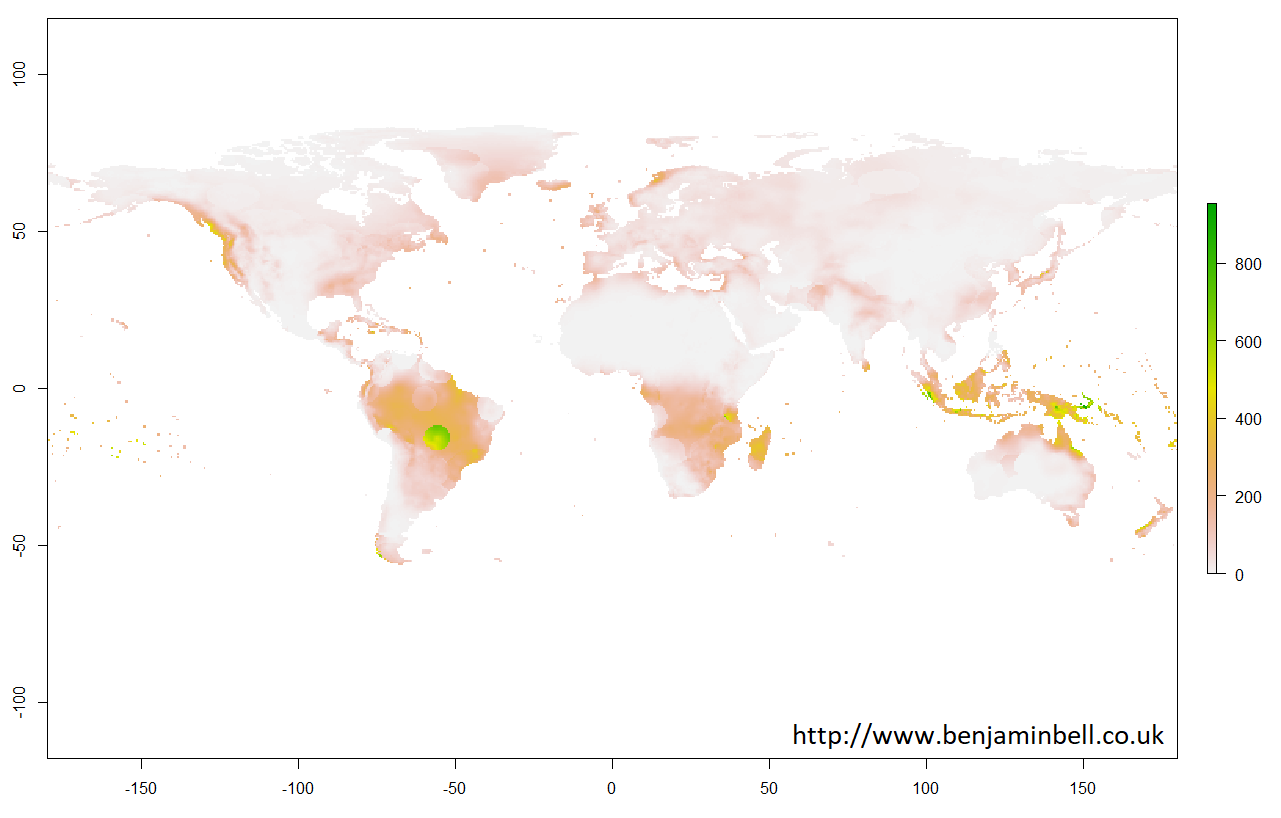
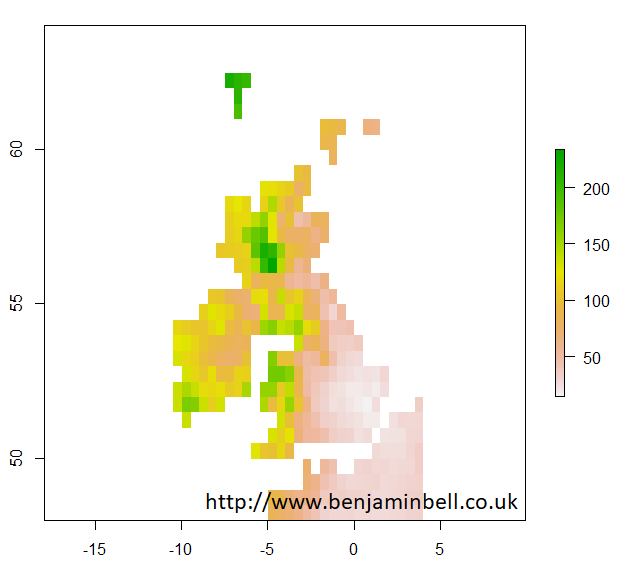
It is possible to plot the information directly from a "RasterBrick" object. Lets quickly plot a map showing global precipitation for January 1901 just to see how the data looks, using this command in the R console:
> plot(pre$X1901.01.16)
With raster objects, you can also look more closely at a particular area by using extent() to define the area using coordinates, and then by using crop() to create a new object using the original raster object data cropped to the new area. Lets take a closer look at the UK:
> uk.area <- extent(-12, 4, 48, 64)
> uk <- crop(pre, uk.area)
> plot(uk$X1901.01.16)
Later guides will look at plotting climate data in more detail, so let's get back to extracting climate data from the CRU TS dataset.
If, for example you wanted climate data for a number of your sample sites, you would need to tell R the coordinates of these sites for it to extract the relevant data. You can do this by creating a matrix or data.frame containing your sample sites, putting your sample names as the row names, column 1 as longitude, and column 2 as latitude. If you are unsure how to do this, please check out my Getting Started with R Guide for help.
But, say you already have a spreadsheet of sample sites, rather than recreate it in R, we shall import the existing data.
Go ahead and create a spreadsheet using your favourite spreadsheet software, or Google Docs will also work. Create a simple spreadsheet which contains 4 sample sites, and their coordinates, using column names "site", "lon" and "lat" and save the spreadsheet as a .csv file as below.

Or, you can download the spreadsheet I have already created, available on Google Docs
Save the spreadsheet to the same directory you are currently working in (CRU climate) as "samples.csv", and then import the data into R using the following code:
# Import sample site information
samples <- read.csv("samples.csv", header=TRUE, row.names="site", sep=",")
Don't worry if you get a warning message here - it can safely be ignored.
If you wanted to check that your sample sites have the correct coordinates and appear in the right place, you could plot them on your map which you made earlier:
> plot(uk$X1901.01.16)
> points(samples, pch=16)
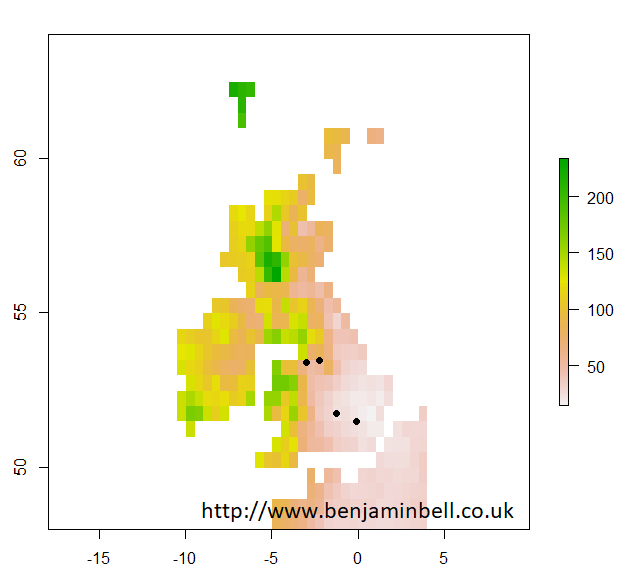
Which looks about right!
Now, lets go ahead and extract the climate data for our 4 sample sites using the extract() command from the raster package:
# Extract climate data from the RasterBrick as a data.frame
pre.sites <- data.frame(extract(pre, samples, ncol=2))
The above code tells R to create a new data.frame object called "pre.sites", where it will extract information from the RasterBrick object "pre" (which contains all the climate data), using the coordinates found in the "samples" object (which we imported our sample site data too).
If you were to then look at the data using fix("pre.sites") you should now see a table with your 4 sample sites and the monthly precipitation data for these sites.

We can make this table a bit more user friendly. Lets add the sample site names to the table using the row.names() command:
# Add sample site names
row.names(pre.sites) <- row.names(samples)
Here, we have changed the row names of the data.frame object "pre.sites" to use the same names from our imported spreadsheet.
Lets also change the column names to be a bit easier to work with - we'll name them using the convention: year followed by month. If you were to rename 1392 columns manually, this could take quite a long time! But, in R, there is a much easier and faster way.
First, create two vector objects containing the years and months. There is no need to type each year, simply the start and end years, seperated by a colon.
# Change column names
years <- 1901:2016
month <- c("Jan", "Feb", "Mar", "Apr", "May", "Jun", "Jul", "Aug", "Sep", "Oct", "Nov", "Dec")
Now, we will rename the columns of our data.frame using the names() command, the paste() command, and the rep() command.
names(pre.sites) <- paste(rep(years, each=12), rep(month, times=116), sep="_")
This code tells R to firstly "paste" each year (taken from the "years" object) 12 times for each month. It then "pastes" the names of the months (taken from the "month" object) 116 times for each year, and uses an underscore to separate them.
When you look at the data now fix("pre.sites") it should appear a lot more user friendly!

Now that we have extracted the precipitation data for our samples sites, lets export that data to a spreadsheet. You can use different packages to export to any file format, including Excel files, but for now, we will stick to the defaults and export a .csv file of our data, which you should be able to open in most software programs.
# Save the extracted climate data to a .csv file
write.csv(pre.sites, file="Precipitation Data.csv")
And that's it! You have successfully downloaded CRU climate data, opened it in R, and extracted only the data you want for your sample sites!
You should now be able to follow this guide to extract mean temperature data from the other CRU file you downloaded - just remember to change object names from "pre" to "tmp", and change the variable name when loading the dataset to "tmp". You could also experiment with some of the other datasets available from CRU.
Here's the complete code to extract precipitation and temperature data in case you get stuck:
# Extracting CRU Climate data: CRU TS v4.01
# Complete guide available at: http://www.benjaminbell.co.uk

# Load packages
library(raster)
library(ncdf4)

# Load the CRU TS datasets into R
pre <- brick("cru_ts4.01.1901.2016.pre.dat.nc", varname="pre") # Precipitation
tmp <- brick("cru_ts4.01.1901.2016.tmp.dat.nc", varname="tmp") # Mean monthly temperature

# Import sample site information
samples <- read.csv("samples.csv", header=TRUE, row.names="site", sep=",")

# Extract climate data from the RasterBrick as a data.frame
pre.sites <- data.frame(extract(pre, samples, ncol=2)) # Precipitation
tmp.sites <- data.frame(extract(tmp, samples, ncol=2)) # Mean monthly temperature

# Add sample site names to the data.frame
row.names(pre.sites) <- row.names(samples)
row.names(tmp.sites) <- row.names(samples)

# Change column names
years <- 1901:2016
month <- c("Jan", "Feb", "Mar", "Apr", "May", "Jun", "Jul", "Aug", "Sep", "Oct", "Nov", "Dec")
names(pre.sites) <- paste(rep(years, each=12), rep(month, times=116), sep="_")
names(tmp.sites) <- paste(rep(years, each=12), rep(month, times=116), sep="_")

# Save the extracted climate data to a .csv file
write.csv(pre.sites, file="Precipitation Data.csv")
write.csv(tmp.sites, file="Temperature Data.csv")
Thanks for reading, if you have any comments please leave them below!
This is a 4 part guide:
| Part 1: Getting Climate Data | Downloading CRU climate data and opening it in R. |
| Part 2: Working with extracted CRU climate data | How to use the downloaded climate data, from calculating trends to plotting the data. |
| Part 3: Extracting data and making climate maps using WorldClim datasets | How to obtain WorldClim climate data, importing it into R, and how to calculate trends and plot climate maps. |
| Part 4: RasterStacks and raster::plot | An update to part 3, this guide shows you an easier way to import WorldClim data into R by using RasterStacks. |
Further reading
Working with the extracted climate data - Part 2 of this guide!
Extracting Worldclim climate data - Part 3 of this guide!
Really cool Benjamim. Thank you for sharing!
ReplyDeleteYou’re welcome. Glad it is of some use!
DeleteThanks, the most accessible for understanding guide on cruts from those that I saw.
ReplyDeleteThanks for the comments, glad this has been helpful!
DeleteYou are a very good teacher
ReplyDeleteThanks for the kind comments!
DeleteThank you very much. This was so easy to follow and super helpful.
ReplyDeleteHi! Thank you for this tutorial. It's very helpful! I'm having trouble extracting the files. I downloaded 7-zip but when I try to extract the file, a message pops up telling me that it's not a file...
ReplyDeleteWhat could be happening? Thanks for your help in advance!
Hi Antonella,
DeleteCan I clarify if you are having trouble with 7-Zip or the file you downloaded?
For 7-Zip, after you have downloaded and installed it, you should get a new option on the context menu when you right click on a file which says "7-Zip". When you hover over this option, you'll get several new options including "Open Archive" and "Extract files..."
"Extract files..." is the one you want for opening the climate data.
Assuming that 7-Zip is working fine - have you tried to re-download the climate data? Make sure you download the file ending ".nc.gz" which is the "gzipped" file. Instead of using the download link on the website, you could try right-clicking the link and selecting "Save Link As..." or "Save Target as..." to download.
Hope this helps,
Ben
Dear Mr. Bell, this is a very useful tutorial, thank you for your time and efforts.
ReplyDeleteI would like to know how you have got the extent of the uk.area.
Is there any link providing those information for any country?
Hope to hear soon from you.
Hi Abdou,
DeleteYou can download shapefiles and import them into R from various websites. A couple good ones which include files for every country include:
https://www.diva-gis.org/gdata
https://gadm.org/download_country_v3.html
You can also download the files directly from within R using the raster package. For example, to download and plot Morocco, you could use the following code:
install.packages("raster") # install package
library(raster) # load package
morocco <- getData('GADM', country="MA", level=0) # download country outline
plot(morocco) # plot data
You can get other counties by using the ISO code: https://en.wikipedia.org/wiki/ISO_3166-1
And you can also download regions for each country by changing the level argument. Take a look at ?getData for details.
Best wishes,
Ben
Mr. Ben,
ReplyDeleteThank you very much for this information, I really appreciate.
Warm regards.
Thank you very much for this tutorial. You can't imagine how much you have helped me.
ReplyDeletecheers!
Many thanks for this helpful guide. Can you please kindly mention the units for each extracted climatic variable (such as precipitation, temperature etc)? I am a bit confused with the units. Thanks a lot!
ReplyDeletePrecipitation = mm
DeleteTemperature = degrees Celsius
I am just wonder whether or not some variables values are scaled at 10 such as (MAT/10) or (MAP*10). Do we need any transformation or not? Many thanks!
DeleteFor these datasets, no transformation is necessary.
DeleteBest wishes,
Ben
Dear Ben
ReplyDeleteIn accordance with your shared R code, I tried to extract CRU pre data for my region. But the output .xls contains the NA values. I think the value extraction code is not correctly executed. Could you correct me in this regard? I shared the code and stations for your kind consideration. Thanks in advance.
library(raster)
library(ncdf4)
nc.pre <- nc_open("cru_ts4.03.1901.2018.pre.dat.nc")
pre <- brick("cru_ts4.03.1901.2018.pre.dat.nc", varname="pre")
plot(pre$X1901.01.16)
bd.area <- extent(88,93,20,27)
bangladesh<-crop(pre,bd.area)
plot(bangladesh$X1901.01.16)
samples <- read.csv("BMDstation.csv", header=TRUE, row.names="station", sep=",")
plot(bangladesh$X1901.01.16)
points(samples, pch=16,col="black")
pre.sites <- data.frame(extract(pre, samples, ncol=2))
row.names(pre.sites) <- row.names(samples)
years <- 1901:2018
month <- c("Jan", "Feb", "Mar", "Apr", "May", "Jun", "Jul", "Aug", "Sep", "Oct", "Nov", "Dec")
names(pre.sites) <- paste(rep(years, each=12), rep(month, times=116), sep="_")
write.csv(pre.sites, file="Precipitation Data.csv")
###
station lat long
B arisal 22.75 90.36666667
Bhola 22.68333333 90.65
Bogra 24.85 89.36666667
Chandpur 23.26666667 90.7
Chittagong (patenga) 22.27 91.82
Chuadanga 23.65 88.81666667
Comilla 23.43333333 91.18333333
Cox's 21.45 91.96666667
Dhaka 23.76666667 90.38333333
dinajpur 25.65 88.68333333
Faridpur 23.6 89.85
Feni 23.03333333 91.41666667
Hatiya 22.43333333 91.1
Ishurdi 24.13333333 89.05
Jessore 23.18333333 89.16666667
Khepupara 21.98333333 90.23333333
Khulna 22.78333333 89.53333333
Kutubdia 21.81666667 91.85
M.Court 22.86666667 91.1
Madaripur 23.16666667 90.18333333
Mongla 22.46666667 89.6
Mymensigh 24.71666667 90.43333333
Patuakhali 22.33333333 90.33333333
Rajshahi 24.36666667 88.7
Rangamati 22.53333333 92.2
Rangpur 25.73333333 89.23333333
Sandwip 22.48333333 91.43333333
Satkhira 22.71666667 89.08333333
Sayedpur 25.75 88.91666667
Sitakunda 22.58333333 91.7
Srimongal 24.3 91.73333333
Sylhet 24.9 91.88333333
Tangail 24.25 89.93333333
Teknaf 20.86666667 92.3
Best, Nasir
Hi Nasir,
DeleteSwap the lat and lon columns for your places you want to extract climate data for and it should then work.
E.g. Station / lon / lat
Best wishes
Hey Benjamin! Thank you for the outstanding code. I wanted to ask that how can we plot stations file (stn file), I would like to know how many stations are available in my study area of interest. The station files are avaialble in stn.gz format, how can I know the number of stations present in a particular region? Can you provide an example for that?
ReplyDeleteHi - unfortunately this is not something I've looked into yet, so unable to offer any guidance - but something I will try and look at for a future blog post!
DeleteHi, Mr.Ben,
ReplyDeleteThank you so much, the blog helps me a lot.
But I have a question want to ask:
how dou you think the PET unit? It's mm/day, so the data unit we download was mm/day right? Every month had a data, and the unit was mm/day.
So if I want to calcute the annual mean PET to mm/year(1901-2016), what should I do?
Thank you again.
Best wishes
Yue
Hi Yue,
DeleteYes, PET is mm/day - if you want mean annual data, you simply need to sum all the month's PET values, and divide by 12. Check out the second part of this guide (there is links at the end of this guide), which shows you how to do this for precipitation - but you can do the same think for PET.
Best wishes
Thank you for this lesson! I'm using the updated data (1901-2018) and when I run the code to # Extract climate data from the RasterBrick as a data.frame, I get an error message:
ReplyDeleteError in UseMethod("extract_") :
no applicable method for 'extract_' applied to an object of class "c('RasterBrick', 'Raster', 'RasterStackBrick', 'BasicRaster')"
Error: 1 components of `...` were not used.
We detected these problematic arguments:
* `ncol`
Did you misspecify an argument?
Hi,
DeleteThe code should still work with newer versions of the CRU dataset - although i am aware they have added additional variables to them (number of stations), but i have used the code without error using the latest data.
That error message suggests a problem with the R code used - can you include the code you used so i can try and replicate the error?
Best wishes,
Ben
Hey Hi, Thanks for this brilliant code. However, I am getting an error message while opening the file, using nc_open. I am using R version 3.4.2, as specified in the tutorial. The required tmp file is also in the working directory.I am writing the whole code for your reference, please point out the error.
ReplyDelete> install.packages("raster")
Warning in install.packages("raster") :
'lib = "C:/Program Files/R/R-3.4.2/library"' is not writable
--- Please select a CRAN mirror for use in this session ---
also installing the dependencies ‘sp’, ‘Rcpp’
There are binary versions available but the source versions are later:
binary source needs_compilation
sp 1.3-1 1.4-2 TRUE
Rcpp 1.0.1 1.0.4.6 TRUE
raster 2.8-19 3.1-5 TRUE
Binaries will be installed
trying URL 'https://cran.asia/bin/windows/contrib/3.4/sp_1.3-1.zip'
Content type 'application/zip' length 1538742 bytes (1.5 MB)
downloaded 1.5 MB
trying URL 'https://cran.asia/bin/windows/contrib/3.4/Rcpp_1.0.1.zip'
Content type 'application/zip' length 4376246 bytes (4.2 MB)
downloaded 4.2 MB
trying URL 'https://cran.asia/bin/windows/contrib/3.4/raster_2.8-19.zip'
Content type 'application/zip' length 2842768 bytes (2.7 MB)
downloaded 2.7 MB
package ‘sp’ successfully unpacked and MD5 sums checked
package ‘Rcpp’ successfully unpacked and MD5 sums checked
package ‘raster’ successfully unpacked and MD5 sums checked
The downloaded binary packages are in
C:\Users\raisa\AppData\Local\Temp\Rtmp636okj\downloaded_packages
> install.packages("ncdf4")
Installing package into ‘C:/Users/raisa/Documents/R/win-library/3.4’
(as ‘lib’ is unspecified)
There is a binary version available but the source version is later:
binary source needs_compilation
ncdf4 1.16.1 1.17 TRUE
Binaries will be installed
trying URL 'https://cran.asia/bin/windows/contrib/3.4/ncdf4_1.16.1.zip'
Content type 'application/zip' length 2482193 bytes (2.4 MB)
downloaded 2.4 MB
package ‘ncdf4’ successfully unpacked and MD5 sums checked
The downloaded binary packages are in
C:\Users\raisa\AppData\Local\Temp\Rtmp636okj\downloaded_packages
> library(raster)
Loading required package: sp
Warning messages:
1: package ‘raster’ was built under R version 3.4.4
2: package ‘sp’ was built under R version 3.4.4
> library(sp)
> library(raster)
> library(ncdf4)
Warning message:
package ‘ncdf4’ was built under R version 3.4.4
> setwd("C:/Users/raisa/Documents/R/win-library/CRU Climate")
> getwd()
[1] "C:/Users/raisa/Documents/R/win-library/CRU Climate"
> nc.tmp <- nc_open("cru_ts4.02.1991.2000.tmp.dat.nc")
Error in R_nc4_open: Permission denied
Error in nc_open("cru_ts4.02.1991.2000.tmp.dat.nc") :
Error in nc_open trying to open file cru_ts4.02.1991.2000.tmp.dat.nc
Best Wishes
Saumitra Rai
Indian Institute of Remote Sensing
BITS Pilani, India
Hi Saumitra,
DeleteYou are able to use later versions of R with this guide (rather than the one specified), and sometimes this can help resolve issues you are having.
I am not sure exactly what is causing the issue here, but it seems you do not have full permissions to access your drive - are you working on a work computer? Usually putting files in your Documents folder (as you have done here) should solve the permission issue, so i am not sure why it hasn't here.
Are you sure the dataset file is in the directory that you are trying to open it from?
An easy way to check is to run the command list.files() in the R console, which will tell you everything in the current working directory.
Another way to check if you have read/write access to the file is to run the following commands:
write.csv(1:10, "test.csv")
This should create a simple csv file within the current working directory. You can then open it using:
read.csv("test.csv")
- If you get errors on either of these steps, it would suggest you do no have proper read/write access, and so you will need to contact your IT administrator (if using a work pc) to resolve this.
Best wishes
Hi Ben,
ReplyDeleteThanks for this instant response. I was just trying to find the error in the code, actually the directory in my code should have included (cru_ts4.02.1991.2000.tmp.dat.nc) at the end, since the actual zipped file was within the folder of the same name. I was imitating your code without taking this into account, which was wrong. When I used the code below, it worked just fine.
>setwd("C:/Users/raisa/Desktop/IIRS/LADHAK DATA/CRU Climate/cru_ts4.02.1991.2000.tmp.dat.nc")
> getwd()
[1] "C:/Users/raisa/Desktop/IIRS/LADHAK DATA/CRU Climate/cru_ts4.02.1991.2000.tmp.dat.nc"
> nc.tmp <- nc_open("cru_ts4.02.1991.2000.tmp.dat.nc")
Thank you
PS: Your Blog is amazing.
This comment has been removed by the author.
ReplyDeleteThis comment has been removed by the author.
ReplyDeleteHello, thank you for the excellent code! It has been really useful.
ReplyDeleteI ran into a bit of trouble trying to rename the column names. My monthly average temperature data spans from 2010-2018 so to rename the columns I have this code:
years <- 2010:2018
month <- c("Jan", "Feb", "Mar", "Apr", "May", "Jun", "Jul", "Aug", "Sep", "Oct", "Nov", "Dec")
names(tas20102018) <- paste(rep(years, each=12), rep(month, times=9), sep="_")
However the column names do not change. On another note, I was wondering if you may know how I can change this data into a 'long' format so it looks like this (I have 1400 sites):
Site Month Year Temperature
A 1 2010 10.1
A 2 2010 11.3
Or bonus points if I can somehow extract specific month and year temperature data for each of my animal observations at my sites. My data consists of presence of animal observations across different sites in the UK from 2010-2018. Thank you so much in advance!
Hi Jasmine,
DeleteFor the first point - i am not sure why that code isn't working, as it is working for me. Perhaps you could post the error message you are getting?
One thing you can check is the number of columns matches the number of names you are creating, as these must be the same or it will cause an error:
length(paste(rep(years, each=12), rep(month, times=9), sep="_"))
length(tas20102018)
Both numbers should match.
For the second query - currently the data frame is set up with the dates as the columns (the variables), and the sites as the rows showing temperature (the observations). You would want to reshape the data - effectively, you would create the site, month and year as observations (as well as temperature).
Here is the code to do it using the example code in this guide (you'll have the change the object names and variables to match your own data):
df <- data.frame(rownames(pre.sites[1,]), paste(rep(month, times=116)), paste(rep(years, each=12)), as.numeric(pre.sites[1,]))
names(df) <- c("Site", "Month", "Year", "Temperature")
And for your other sites - you can create separate data frames. I'm not sure why you'd want to arrange the data this way though!
You can find a specific value from the data frame using which(). Here's an example (based on the code from this guide:
pre.sites[which(names(pre.sites) == "2015_Oct")]
Which would return the following information:
2015_Oct
Manchester 76.3
Liverpool 69.0
Oxford 40.3
London 52.0
Hope this helps,
Ben
Dear Benjamin,
ReplyDeleteThank you very much for your script to extract climate data from the .nc file of CRU. The following script finds a little bit difference results for London precipitation comparison to your script. I didn't find the problem. The script is here:
library(raster)
library(sp)
library(ncdf4)
setwd("C:/Users/user/Desktop/CRU_climate_nc")
nc.pre <- nc_open("cru_ts4.04.1901.2019.pre.dat.nc")
nc.pre
pre <- brick("cru_ts4.04.1901.2019.pre.dat.nc", varname= "pre")
pre
pre.df <- as.data.frame(extract(pre,matrix(c(-0.11,51.49), ncol = 2)))
head(pre.df)
Best Wishes
Barbaros YAMAN
Hi Barbaros,
DeleteII am not sure i follow - i have just run your script, and i get the exact same data.
Can you elaborate on the issue?
Thanks,
Ben
Dear Benjamin,
ReplyDeleteThank you very much for doing this amazing job! As a person, who usually works in Stata and is not familiar with R, I cannot thank you enough.
For my research, I need the data about temperature and precipitation in the Indonesian sub-districts (kabupaten, adm. level - 2) in 2000-2015. From your previous answers, I understood that one can get shapefiles for Indonesia using getData function. What I do not understand is how to connect those shapefiles and climate data from CRU in one .csv file, which would contain the table with monthly temperature/precipitation in Indonesian sub-districts. In your example, it was 4 cities and they were defined with 1 longitude and 1 latitude, in my case the sub-districts are defined by some boundaries and I am not sure how to work with that. Any tips on the issue would be highly appreciated.
Many, many thanks and best wishes,
Jema
Hi,
DeleteYou should be able to extract the CRU data using shapefiles in a similar way you do using lon and lat coordinates.
If that doesn't work, you could always pick a random lon/lat that lies within the boundary of your sub-district, and then follow the guide to get the data.
Best wishes,
Ben
Hi Ben,
DeleteI am also trying to work with the CRU data with shapefile which is from gadm. After I extracting the precipitation data using shapefile following your steps, it outputs a list consist of matrixes of all the sites, instead of just one matrix. So I cannot transform it into a data frame.
In addition, I found the matrix of different sites has different number of rows. I don't know why.
Could you please help me to figure out what to do next to get the annual mean precipitation for different regions?
I attached my codes here:
library(raster)
library(cruts)
library("ncdf4")
library(sf)
library(sp)
library(raster)
library(rgeos)
pre <- brick("./cru_ts4.04.2011.2019.pre.dat.nc/cru_ts4.04.2011.2019.pre.dat.nc", varname="pre")
chn2 <- getData("GADM", country = "China", level = 2)
pre.sites.chn2 <- extract(pre, chn2)
Best wishes,
Baoqian
Hi Baoqian,
DeleteWhile you can use shapefiles to get data, as you have found, you may end up with lots more data than you expected.
To try and explain, the CRU data is split into grid cells that cover the globe. When you use specific coordinates to extract data, this will always come from a single grid cell. However, If you use a shapefile, the area covered by the shape will likely include many grid cells, so all of this data is extracted.
Therefore, additional work is needed to make this data useable, such as averaging or summing etc.
CRU has datasets avail which provide country averaged climate data, so this might be more suitable for your use case. Take a look here https://catalogue.ceda.ac.uk/uuid/d6768285fdc8408bbb9b02bb0f317774
Best wishes,
Ben
Nice tutorial, trying to adapt for daily netcdf precip data. How to extract for daily time steps in the different sites for the selected area?
ReplyDeleteHi, can you provide a bit more information regarding your issue?
Deletee.g. Which dataset you are using, which sites etc.
Perhaps drop me and email and I will see if I can help. Details on the contact page.
Best wishes
Hi, Thanks for sharing such a valuable script. Can you please validate with data extracted using ArcGIS? because i have checked with ArcGIS extracting tool (NetCDF as Table view) data is different then the extracted by your script. Please don't mind it. thank you.
ReplyDeleteHi Zakria,
DeleteYou can check you have extracted the right data by plotting a map. This guide shows you how to check the data by visualising it.
The most likely reason for the miss match in data is because the Lat and Lon coordinates are in the wrong order. R reads coordinates as lon, then lat (I.e. x then y), whereas the general convention is to use lat, lon. Ensure you have given the correct coordinates to r.
Best wishes,
Ben
Awesome thank you/ You made very easy
ReplyDeleteGreat tutorial. Would it be possible to know how to extract by year. Also, create an aggregate file for each year
ReplyDeleteWhat a wonderful tutorial it is. I have consistently follow the step by step procedure and command to extract the climate data for my dissertation.It works well for me. Thank you once again!
ReplyDeleteHi Benjamin!
ReplyDeleteI am using CRU Dataset for a project. Can you please inform where can I find the unit that the datasets are in?
Thank you
Saumitra Rai
BITS Pilani, India
Hi Saumitra,
DeleteYou can get information about the units on this webpage: https://crudata.uea.ac.uk/cru/data/hrg/ - scroll down to the bottom to find them.
Alternatively, as described in this guide, use the nc_open() command to view detailed information about the dataset, which will include details about the units.
Best wishes,
Ben
You are a rockstar Sir! Hats off. I spent a week learning this but no avail, it took me one night to follow your guide. This is how all guides should be. Bless you
ReplyDeleteHi Benjamin,
ReplyDeleteI am working on a project to predict precipitation. I am using the Temperature, Potential Evaporation, Cloud Cover, Wet Days and Vapor Pressure as parameters obtained from CRU. However, I also need 'Relative Humidity' data but could not find it on CRU. Is there any way to calculate Relative Humidity from other parameters obtained from CRU? If not, then can you suggest an alternative source where I can find the monthly data for Relativity Humidity of Himalayas (in India)?
Thank you,
Saumitra Rai
BITS Pilani, India
Humidity is included in the re-analysis work on the CRU dataset which is available here: https://catalogue.ceda.ac.uk/uuid/7f785c0e80aa4df2b39d068ce7351bbb
DeleteHowever, i do not have a guide for using this dataset - but the format is the same as the other CRU datasets.
Thanks for the fast reply, just checked it out. The data is in 6 hour format, while I require monthly mean. May need to find some other source. But thanks for your help.
DeleteSure, but you can calculate monthly averages from the 6 hourly data. I previously sent somebody some code to calculate daily data using this 6 hourly dataset (albeit for precipitation), and attach the code below.
DeleteFeel free to use this/adapt to calculate monthly if its useful. This code uses an index to calculate daily totals. This is based on there being 4 records per day. For monthly data, you could calculate the daily data first, then create a second index based on the number of days in each month.
Good luck!
# Extracting CRU Climate data - CRU JRA v2.0 6 hourly
# Load packages
library(raster)
library(ncdf4)
# Load the CRU dataset into R (6 hourly)
pre <- brick("crujra.v2.0.5d.pre.1901.365d.noc.nc", varname="pre")
# Calculate daily data
ind <- rep(1:(nlayers(pre)/4), each=4)
pre.daily <- stackApply(pre, indices=ind, fun=sum)
# Rename layers
pre.name <- unique(format(attr(pre,"z")$Date, "%Y_%b_%d"))
names(pre.daily) <- pre.name
Thanks a lot! This would help me.
DeleteHi Benjamin,
ReplyDeleteis there an easy way to extract the data of temp and pre of all countries at the same time?
thankyou,
Maria
You could write a script to automate it, but the extract function will already extract data for each set of coordinates you give it.
DeleteBut, if you are looking for country averages, there is a different dataset you could use: https://crudata.uea.ac.uk/cru/data/hrg/cru_ts_4.05/crucy.2103081329.v4.05/
Best wishes,
Ben
I've referred to several of your blog pages. They are all super helpful. Thanks for sharing!
ReplyDeleteFirst of all, thanks a lot for this awesome tutorial!
ReplyDeleteIs it somehow possible to create a timeseries for example from 1960 - 2010 with yearly prec and temp values? I'd like to spot eventual differences or changes in respect of temperature and precipitation over time.
Hi,
DeleteYes, that is possible and part 2 of the guide covers annual data.
Best wishes,
Ben
Thanks alot Ben,
ReplyDeleteyour script helped me a lot in my Phd research project. Keep on with the good work
Thank you so much for this extremely useful and clear guide! If only all R tutorials were this easy to follow!
ReplyDeleteThank you so much for this wonderful tutorial.
ReplyDeleteDear Ben,
1- How can I extract the precipitation data for the global extent? I tried to use R to extract the global precipitation (CRU data) but maybe I'm missing something. Please propose me a code that can help me to extract the data for the entire world using the CRU data.
2-In my project, I have to analyse the runoff and precipitation for the entire globle, but I'm really struggling to analyse those data because it is to much. If you have any advice and resources that can help me to analyse this big data, please don't hesitate to share with me.
2- I have used the code you proposed to extract CRU data for a specific area, but I got an error :
> setwd("E:/RDATA/DATA")
> pre <- brick("E:/RDATA/DATA/cru_ts4.03.1961.1970.pre.dat.nc", varname="pre")
> samples <- read.csv("samples.csv", header=TRUE, row.names="site", sep=",")
> pre.sites <- data.frame(extract(pre, samples, ncol=2))
Error in UseMethod("extract") :
"extract"Not applicable" c('RasterBrick', 'Raster', 'RasterStackBrick', 'BasicRaster') "The method of the target object
Error in `extract()`:
! Arguments in `...` must be used.
✖ Problematic argument:
• ncol = 2
ℹ Did you misspell an argument name?
Run `rlang::last_trace()` to see where the error occurred.
Thank you so much for your time and consideration.
Hi Alhassane,
DeleteI'm not sure i fully understand - if you wish to look at the precipitation on a global scale, you not not need to use the extract() function.
The extract() function is designed to look at specific sites/areas, for example, you might want to know the precipitation for a city - you input the coordinates, and extract() will get the information for that area. It is not designed to look at the entire globe.
I don't have specific guidance on how to analyse the entire globe - but it is possible. If you consider the CRU data to be an array (e.g. a 3D matrix) of data - you could look at individual layers (which would be a 2D matrix), and perform calculations (e.g. mean, sum etc.) which might be a starting point. Here's some code to get you started so that you can get the values from the CRU data:
# Show info about raster
pre
# Look at layer 1
pre[[1]]
# Get values for layer 1
pre1 <- values(pre[[1]])
But, you will also want to look at the help pages for raster package, for the functions getValues(), and getValuesBlock()
Best of luck,
Ben
"Error: Unable to allocate vector with size 67.8 GB"
DeleteYou are probably not doing anything wrong - except trying to work with too much data at once. R stores everything in memory, so you will be limited by how much memory your computer has. You may need to work within smaller areas (i.e. not a global extent) to do the analysis.
Best wishes,
Ben
Thank you so much for your disponibility. ok, I will subset the data based on small area. Please, do the station data with the stn extention in the CRU dataset represents the coodinates of the available stations? if yes, how can I open this type of file? if no, where can I download the coordinates of those stations?
DeleteThank you for your valuable time and consideration.
Kind regards
Bah
I'm not really sure about the station files to be honest.
DeleteDear Ben,
Deleteok, thank you so much for your help. I really appreciate your availability.
Dear Ben,
DeleteI have decided to subset the dataset based on small area as you suggested. I was able to download the coordinates fro Glooge Earth pro. But I'm still getting error from the data.frame.
library(sp)
library(raster)
library(ncdf4)
library(here)
library(ggplot2)
library(tidyverse)
pre <- brick("E:/RDATA/DATA/cru_ts4.03.1961.1970.pre.dat.nc", varname="pre")
pre
plot(pre$X1961.01.16)
coordinatessheetAlgeria <- read.csv("coordinatessheetAlgeria.csv", header=TRUE, row.names="ref", sep=",")
points(coordinatessheetAlgeria, pch=16)
# Extract climate data from the RasterBrick as a data.frame
pre.sites <- data.frame(extract(pre, coordinatessheetAlgeria, ncol=2))
Error in `extract()`:
! Arguments in `...` must be used.
✖ Problematic argument:
• ncol = 2
ℹ Did you misspell an argument name?
Run `rlang::last_trace()` to see where the error occurred. I'm unable to find the probleme. Please help to find a solution for this data.frame. Thank you for time.
Kind regards
Bah
Dear Ben,
DeleteI found the solution. Here is the solution for those who will meet the same problem:
# Extract climate data from the RasterBrick as a data.frame
pre.sites<- data.frame(raster::extract(pre, coordinatessheetAlgeria2, ncol = 2))
thank you for this extremely useful guide!
ReplyDeleteHi Ben,
ReplyDeleteYou're an absolute lifesaver, thank you! This post has been so useful in helping me learn how to extract the climate data I need for my thesis.
I do have a couple of questions if that's alright? I'm using the updated version of the dataset, 4.08, and I've got different values of monthly precipitation data for 1901.01.16, 1901.02.15, ...... for Manchester, Liverpool, Oxford and London.
I've pasted my code down below, and I'd really appreciate it if you could have a look and point out where I've gone wrong.
#Followed tutorial "Benjamin Bell, getting climate data"
################################################################################
##### USING THIS CODE, PUT IN DIFFERENT LATITUDE AND LONGITUDE'S FOR THE CITY
##### I WANT TO GET THE DATA ###################################################
################################################################################
setwd("~/Desktop/MRes/R data")
install.packages("raster")
install.packages("ncdf4")
library(raster)
library(ncdf4)
nc.pre <- nc_open("cru_ts4.08.1901.2023.pre.dat.nc")
print(nc.pre)
#Precipitation data file has four variables; "pre" is total precipitation, measured
#in mm/month. For now, we're only concerned with the "pre" variable.
#Load the CRU TS precipitation dataset into R. The code below loads the NetCDF file as
#a "RasterBrick" object, similar to an array, into memory using the raster package.
pre <- brick("~/Desktop/MRes/R data/cru_ts4.08.1901.2023.pre.dat.nc", varname="pre")
#View info about the RasterBrick by inputting object name into R like so:
pre
###*****PLOTTING THE DATA*****
plot(pre$X1901.01.16) #This shows a detailed map of global precipitation for January 1901
#With Raster objects, you can look closer at a particular area using the extent() command
#to define the area using coordinates, and then by using crop() to create a new object
#using the original raster object data cropped to the new area.
uk.area <- extent(-12,4,48,64)
uk <- crop(pre, uk.area)
plot(uk$X1901.01.16) #Shows a plot of the UK precipitation in January 1901, measured in mm/month
#******BACK TO EXTRACTING DATA*******
#If you wanted climate data for a number of your sample sites, you would need to tell
#R the coordinates of these sites for it to extract the relevant data. You can do this
#by creating a matrix or data.frame containing your sample sites, putting your sample
#names as the row names, column 1 as longitude, column 2 as latitude.
# Create a matrix with longitude and latitude data
samples1 <- matrix(c(-2.24, 53.47,
-2.98, 53.4,
-1.25, 51.74,
-0.11, 51.49),
nrow = 4, byrow = TRUE)
# Assign row and column names
rownames(samples1) <- c("Manchester", "Liverpool", "Oxford", "London")
colnames(samples1) <- c("lon", "lat")
# Print the matrix
print(samples1)
plot(uk$X1901.01.16)
points(samples1, pch=16)
#The above is just to show how to do a matrix. Follow on from here.
#But if you have a spreadsheet of sample sites, rather than recreate it in R, import the existing data.
#Create a spreadsheet using Excel, save it into the same directory we're working in AS A CSV FILE,
#and import the data using the following code
samples <- read.csv("samples.csv", header=TRUE, sep=",")
samples <- samples[rowSums(is.na(samples)) != ncol(samples), ] # Remove empty rows
samples <- samples[, colSums(is.na(samples)) < nrow(samples)] # Remove empty columns
samples <- samples[1:4,]
plot(uk$X1901.01.16)
points(samples, pch=16) #this doesn't work and i'm not sure why
#Carrying on, not plotting
pre.sites <- data.frame(extract(pre, samples1, ncol=2)) #Doesn't have the same values that the tutorial does
fix("pre.sites")
Hi Benjamin,
ReplyDeleteI've followed this tutorial exactly with the same files you used in this tutorial, and I get the same results in my 'pre.sites' data frame (Manchester, 1901.01.16, 53.2) (Manchester, 1901.02.15, 36.3)
However, when I download the latest CRU TS 4.08, and change the code to reflect this and run it, my pre.sites values are all completely different. For example, (Manchester, 19.01.16, 40.2). If you could shed some light on this, I'd be really grateful.
Hi Platt,
DeleteAt some point, i think it was version 4.03, CRU changed their interpolation algorithm, which is likely the reason why you get different results, between the different datasets.
So, you haven't done anything wrong, its just because the dataset has been updated.
Incidentally, i note that they have changed the method in the new 4.09 release for precipitation again, as they noted issues in 4.08 in sparsely populated areas (although this wouldn't affect the UK sites used in this example).
Precipitation is much more difficult to interpolate compared to temperature, but as more data becomes available, and better algorithms etc., it should continually improve. That's one of the issues of using gridded data, the results should not be taken as gospel, but used as a guide for the likely climate conditions. Real station observations will always be the best data.
Ben