A quick guide to pch symbols in R, including: which symbols are available, how to use them in plots and how to style them by changing colours, size, and line widths.
A handy reference for pch!
Guide Information
| Title | Quick guide to pch symbols in R |
| Author | Benjamin Bell |
| Published | February 26, 2018 |
| Last updated | August 12, 2021 |
| R version | 3.4.2 |
| Packages | base |
| Navigation |
This guide has been updated:
- Additional information provided to explain the arguments for pch, as well as new visual examples to show the effects of these arguments.
pch symbols in R
pch ("plotting character") is the graphical parameter for drawing symbols on plots in R, usually to represent data points. For example, pch=0 would plot the points as squares. Pch symbols are mapped to integers 0 to 255, including vector symbols, ASCII characters and "native" characters (system specific).
Vector pch symbols
There are 26 vector pch symbols available to R which are compatible across all systems. These can be sub-divided into groups, based on how they can be styled.
0 to 14
Symbols 0 to 14 are "outline" symbols, i.e. they have a border, but no fill.
15 to 20
Symbols 15 to 20 are "solid" symbols and have no border (with the exception of 19). Symbol 20 is a "bullet" and is two thirds smaller than symbols 16 and 19 (circles). Symbol 19 will be larger than 16 when lwd is used.
21 to 24
Symbols 21 to 24 are "filled" symbols, i.e. they have a border and a background colour.
Customising vector pch symbols
You can customise the colour, background colour, line width and size of the pch symbols. Not all customisations are available to all pch symbols.
colFor "outline" (0 to 14) and "filled" (21 to 25) pch symbols, this argument affects the border colour.
For "solid" (15 to 20) pch symbols, this argument affects the entire symbol.
bgThis argument has no affect on "outline" (0 to 14) and "solid" (15 to 20) pch symbols.
lwdThis argument has no affect on "solid" (15 to 20) pch symbols, with the exception of pch symbol 19.
cexCompare the effect of these arguments on the different symbol types:
# Change colour
x <- c(1, 2, 3)
y <- c(1, 1, 1)
plot(x, y, pch=c(1, 16, 21), col="blue")
# Change background (fill) colour
plot(x, y, pch=c(1, 16, 21), bg="gold")
# Change line width
plot(x, y, pch=c(1, 16, 21), lwd=5)
# Change all
plot(x, y, pch=c(1, 16, 21), col="blue", bg="gold", lwd=5)
You can also use col and cex to customise ASCII and native character pch symbols.
If you were plotting some data, and wanted to set the symbols and/or colour based on a parameter, such as a group, you can do that by specifying the symbols, followed by using the subset option [square brackets] to specify the groups. See the following code as an example:
# Create data
set.seed(2333)
x <- rnorm(12)
y <- rnorm(12)
# Create groups
g <- c(1, 1, 1, 1, 2, 2, 2, 2, 3, 3, 3, 3)

# Plot different symbols depending on the group
plot(x, y, pch=c(1, 18, 25)[g], col=c("red", "green2", "blue")[g], bg="skyblue2", lwd=2, cex=4)
# Add labels
text(x, y, labels=1:12, font=2)
Which would result in the following plot:
ASCII symbols
In addition to the default symbols, you can also plot ASCII characters using pch=32:126. ASCII characters are a set of 128 characters which include: numbers 0 - 9, the Latin alphabet (upper and lower case), and some punctuation characters. ASCII is a standard character set which is compatible across all systems and devices.
For example, if you wanted to plot your data points as question marks (?), you could use the following code:
# ASCII characters as pch symbols
plot(x, y, pch=63) # This will plot data points as question marks (?)
You can change the colour col and size cex of the ASCII character symbols.
32 to 126
| 32 | 33 | 34 | 35 | 36 | 37 | 38 | 39 | 40 | 41 | 42 |
| ! | " | # | $ | % | & | ' | ( | ) | * | |
| 43 | 44 | 45 | 46 | 47 | 48 | 49 | 50 | 51 | 52 | 53 |
| + | , | - | . | / | 0 | 1 | 2 | 3 | 4 | 5 |
| 54 | 55 | 56 | 57 | 58 | 59 | 60 | 61 | 62 | 63 | 64 |
| 6 | 7 | 8 | 9 | : | ; | < | = | > | ? | @ |
| 65 | 66 | 67 | 68 | 69 | 70 | 71 | 72 | 73 | 74 | 75 |
| A | B | C | D | E | F | G | H | I | J | K |
| 76 | 77 | 78 | 79 | 80 | 81 | 82 | 83 | 84 | 85 | 86 |
| L | M | N | O | P | Q | R | S | T | U | V |
| 87 | 88 | 89 | 90 | 91 | 92 | 93 | 94 | 95 | 96 | 97 |
| W | X | Y | Z | [ | \\ | ] | ^ | _ | ` | a |
| 98 | 99 | 100 | 101 | 102 | 103 | 104 | 105 | 106 | 107 | 108 |
| b | c | d | e | f | g | h | i | j | k | l |
| 109 | 110 | 111 | 112 | 113 | 114 | 115 | 116 | 117 | 118 | 119 |
| m | n | o | p | q | r | s | t | u | v | w |
| 120 | 121 | 122 | 123 | 124 | 125 | 126 | ||||
| x | y | z | { | | | } | ~ |
Other symbols
"Native" symbols, which may be specific to the OS you are using, or your locale (e.g. language/keyboard settings), can be accessed using pch=128:255.
To see a list of the symbols that are available for your system, use the following code in the R console (your results may vary):
pch <- as.character(128:255)
sym <- intToUtf8(pch, multiple=TRUE)
sym
128 to 159
Pch symbols 128 to 159 are control characters (or control codes). These are special character strings designed to control the display of text. They do not print a character on screen.
160 to 255
These characters may be specific to your locale (keyboard/language setting in your OS), and are usually a collection of accented characters.
Characters as pch symbols
In addition to using a numeric code to tell R which ASCII or "native" pch symbol to plot, you can also use the character itself in quotation marks.
You can also specify a character as the symbol (instead of using numbers). For example, if you wanted your plot points to be represented by the letter a, you could use pch="a". This is case sensitive, so "a" is different to "A".
For example, the following code will plot the symbols as characters:
# Create data
set.seed(2333)
x <- rnorm(12)
y <- rnorm(12)

# Plot symbols as characters
plot(x, y, pch=c("A", "a", "@", "%", "s", "{", "N", "Z", "h", "?", "D", "5"), col=1:12, bg="skyblue2", lwd=2, cex=4)
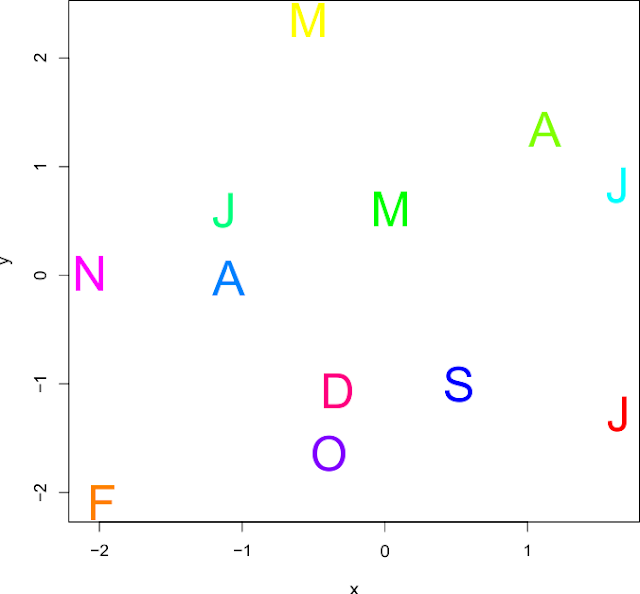
Or, you could set the character symbol automatically based on a parameter in your data, such as labels or groups for your dataset. The "symbol" used will be the first character of the label. See the following code for an example:
# Create data
set.seed(2333)
x <- rnorm(12)
y <- rnorm(12)
# Set labels
m <- c("Jan", "Feb", "Mar", "Apr", "May", "Jun", "Jul", "Aug", "Sep", "Oct", "Nov", "Dec")

# Plot symbols based on labels
plot(x, y, pch=as.character(m), col=rainbow(12), lwd=2, cex=3)
Thanks for reading this guide! Please leave any comments or questions below.
Further reading
A quick guide to line types (lty) - A quick guide to the different line types available in R, and how to use them. [R Graphics]
A quick guide to layout() in R - How to create multi-panel plots and figures using the layout() function. [R Graphics]
Thank you so much!
ReplyDeleteVery rich and effective blog on plotting in R. It's really helpful for a beginner as well as for an advance user of R. Thank you so much for your effort.
ReplyDeleteIn your last example is it possible to put the full name instead of just the first letter? I'm trying to put the number from 1 to 35. By the way, congratulations for your blog. Very useful and didactic.
ReplyDeleteHi Lincoln,
DeleteThanks for your comments. It sounds like you would be better off annotating your plot to get that output. Take a look at my guide to find out how: https://www.benjaminbell.co.uk/2018/03/quick-guide-to-annotating-plots-in-r.html
Best wishes,
Ben